Project 1
Istanbul Shopping Mall Insights (2021–2023)
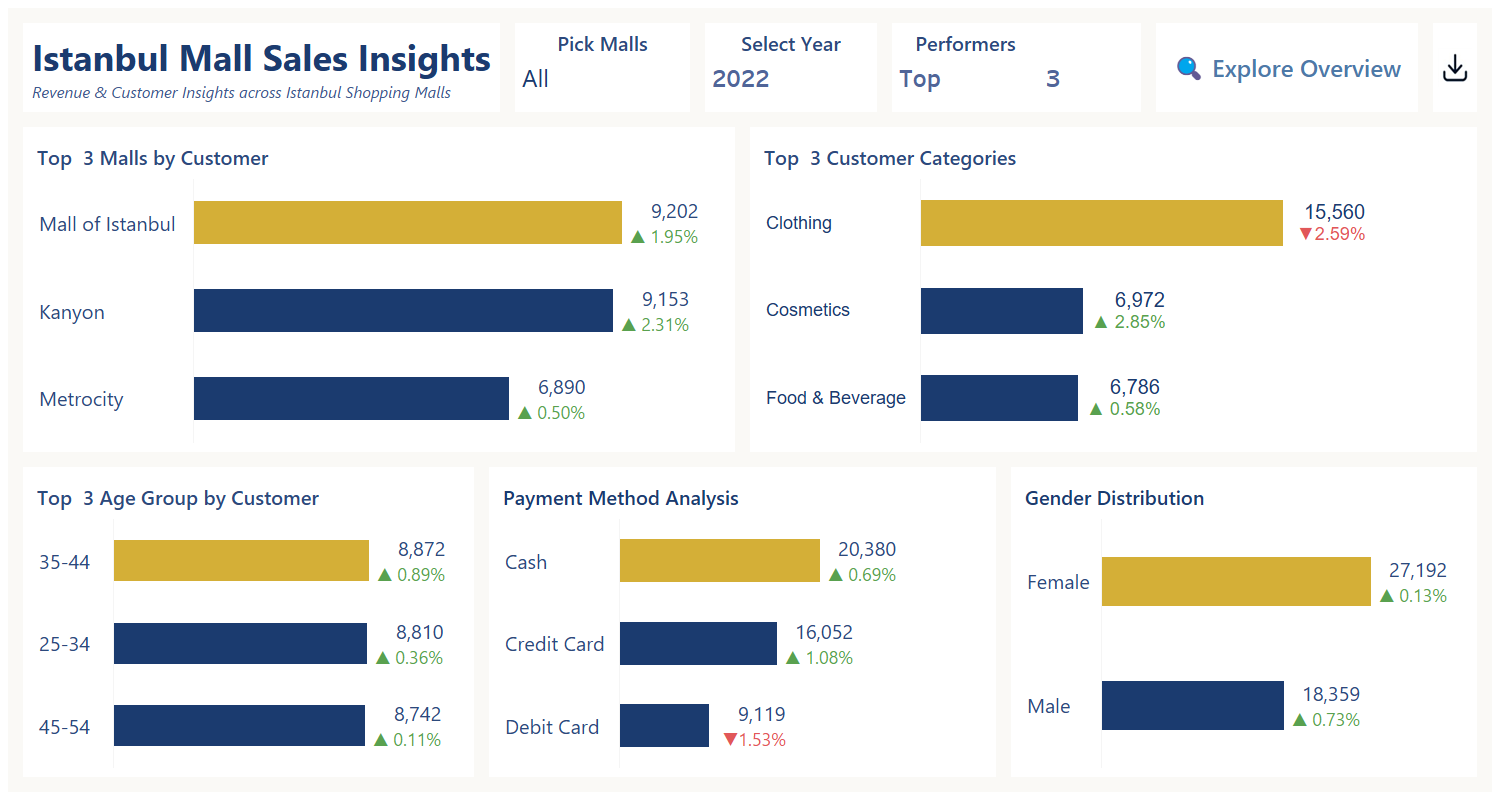
Click the image above to view the live interactive dashboard on Tableau Public.
Performed a three-year performance review of Istanbul shopping malls using Excel Power Query for data modelling and Tableau for visual storytelling. Revealed key trends in revenue, customer loyalty, and demographics to support data-driven decisions in retail strategy and customer engagement.
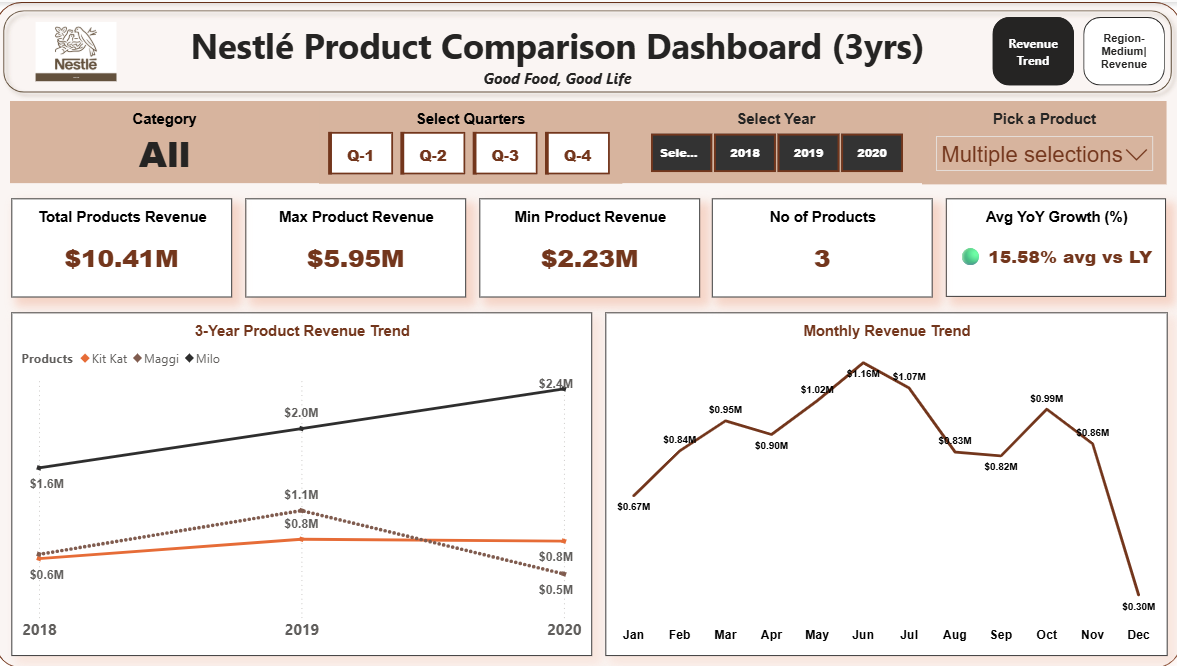
This project details how I developed a Product Comparison Dashboard as part of a case study on Nestlé R&D Australia. As a data analyst, I aimed to support strategic decision-making by analyzing product performance across regions and sales channels. Using Power BI, I transformed raw sales data into actionable insights—highlighting top-performing products, growth opportunities, and areas for improvement.Interested in how data can drive smarter business strategy?
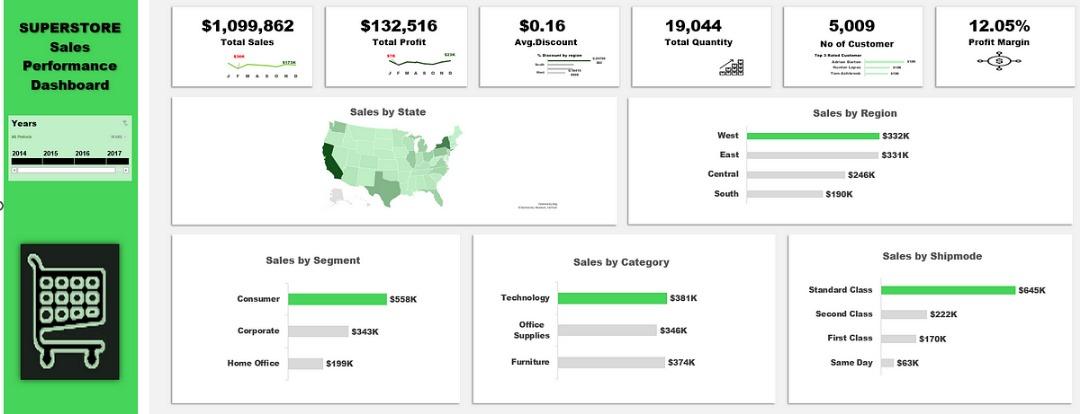
Project 3
Dug into four years of Superstore data (2014 - 2017) to uncover what drives sales, boosts customer loyalty, and reveals hidden growth opportunities. Using Excel, I built a clean, insight-packed dashboard that helps businesses make smarter, faster decisions
 Project 4
UK Holiday Spending Trends (2020-2024): Key Insights for Retailers, Marketers, and Policymakers
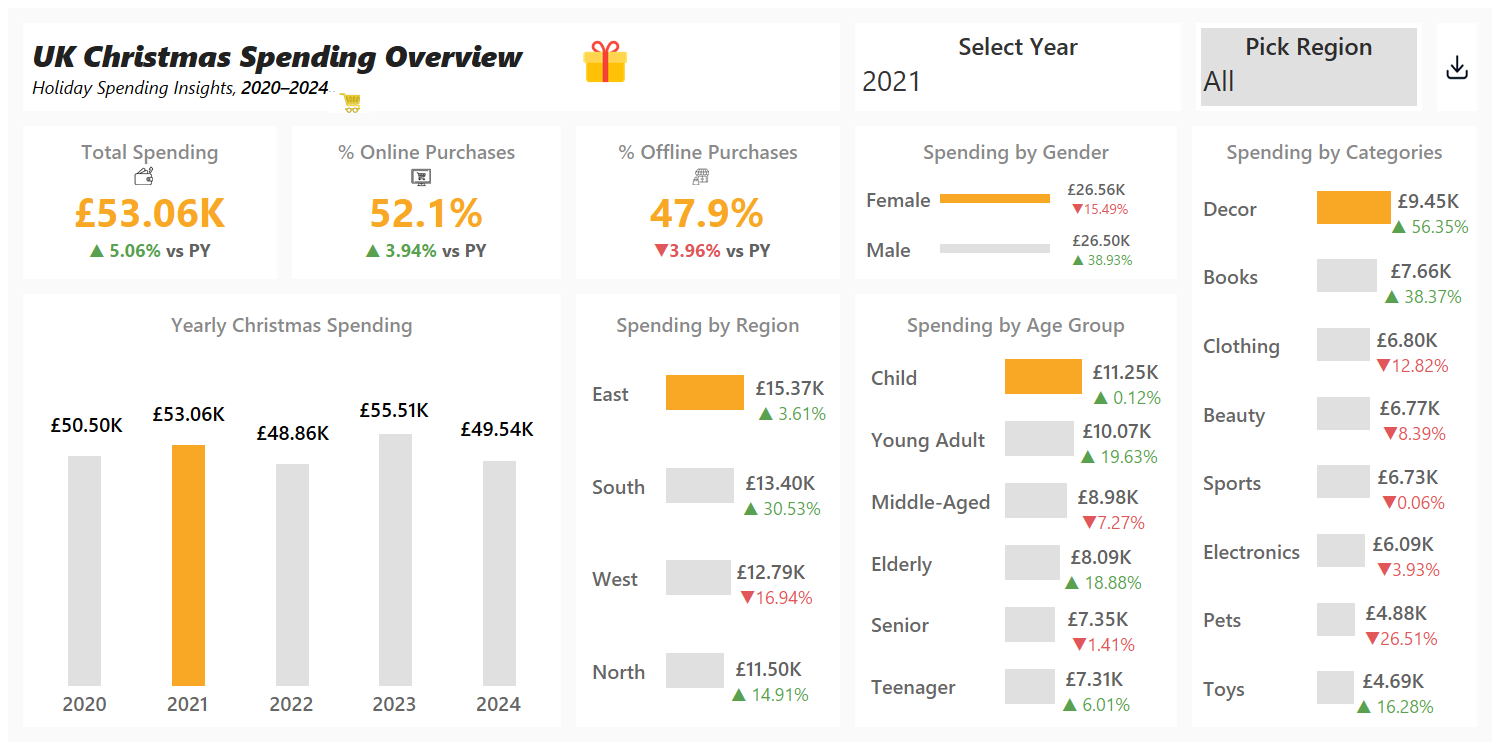
Click the image above to view the live interactive dashboard on Tableau Public.
The holiday season is a critical time for consumer spending, making it important for businesses and policymakers to grasp the trends in UK spending patterns from 2020 to 2024. This understanding will help them refine their strategies as we approach 2025.
In my project, I took a close look at national holiday spending data. I used Excel for prepping the data and created interactive visual dashboards with Tableau to highlight significant trends in consumer behavior. My analysis looks at how spending habits have changed, the growth of e-commerce, and the rising impact of younger shoppers, offering practical insights for retailers, marketers, and policymakers.
By investigating year-on-year growth rates, regional differences, and shifts in product categories, I provide thoughtful recommendations that can help businesses adapt to an ever-evolving market landscape.
Project 5
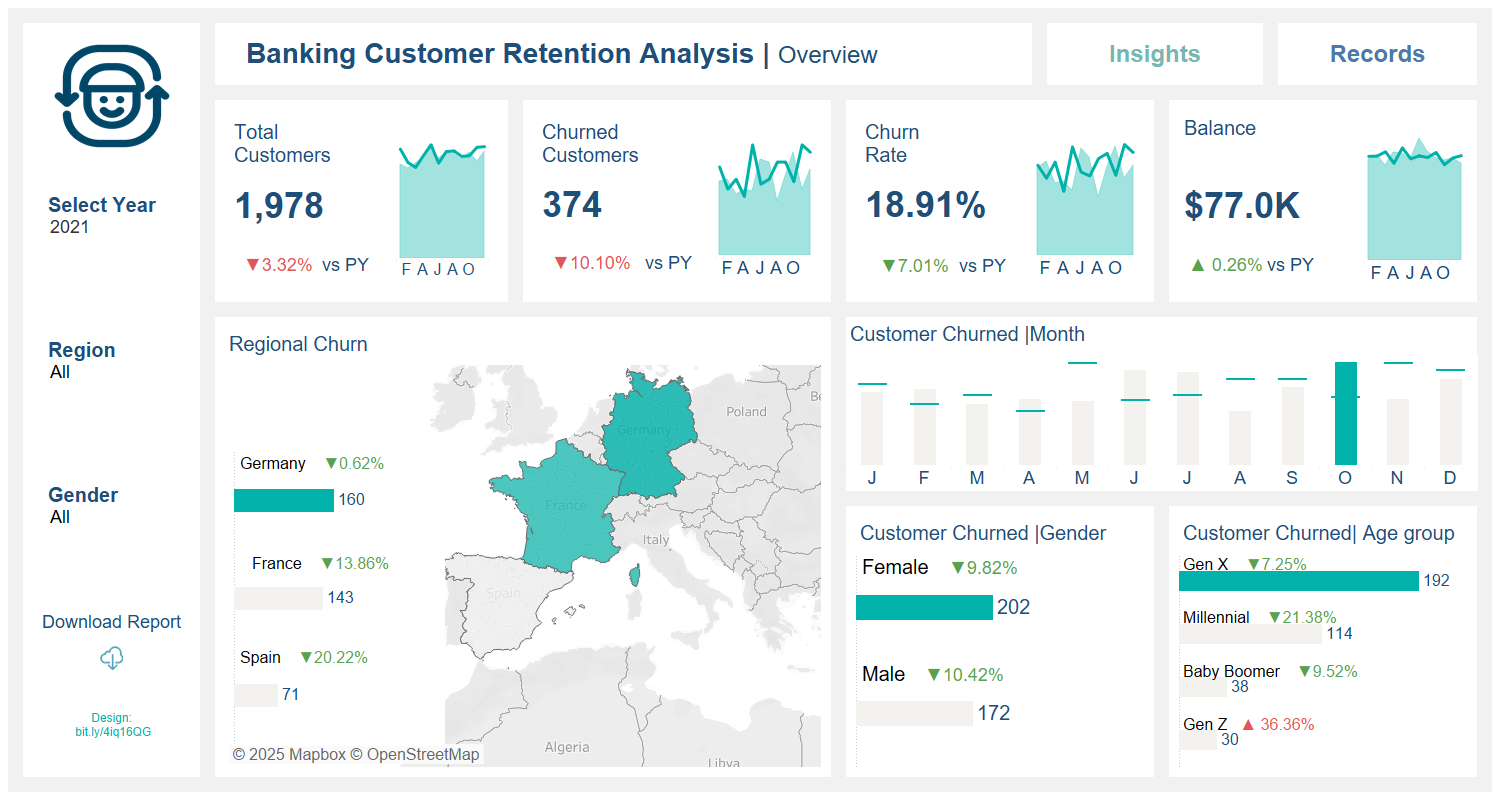
Customer Churn Analysis (2020–2024): Uncovering Insights into Bank Customer Attrition
Click the image above to view the live interactive dashboard on Tableau Public.
Analysed five years of mock banking data to identify factors influencing customer churn. Utilised Excel for data cleaning and Tableau for visualization.
Key Insights:
Higher churn rates among female customers and the Gen X age group.
Seasonal peaks in churn occur during March and December.
Volatility in churn behavior within low/middle-income and fair credit score segments.
Increased churn rates for customers holding a single product.
These findings inform targeted strategies that can effectively enhance customer retention.
In this project, I uncovered actionable insights from non-profit donation data to support smarter fundraising decisions. Using SQL and Excel, I analysed giving behaviour across demographics, donation frequency, and geography for Education for All, a non-profit case study developed to explore fundraising insights and stakeholder strategy.
By joining and segmenting two datasets, I identified high-value donor profiles, underperforming regions, and strategic outreach opportunities. The findings were translated into clear recommendations that could help any non-profit organisations expand its donor base, increase engagement, and raise overall contributions.
This project demonstrates how I combine technical skills with business thinking to transform raw data into practical, decision-ready insights.
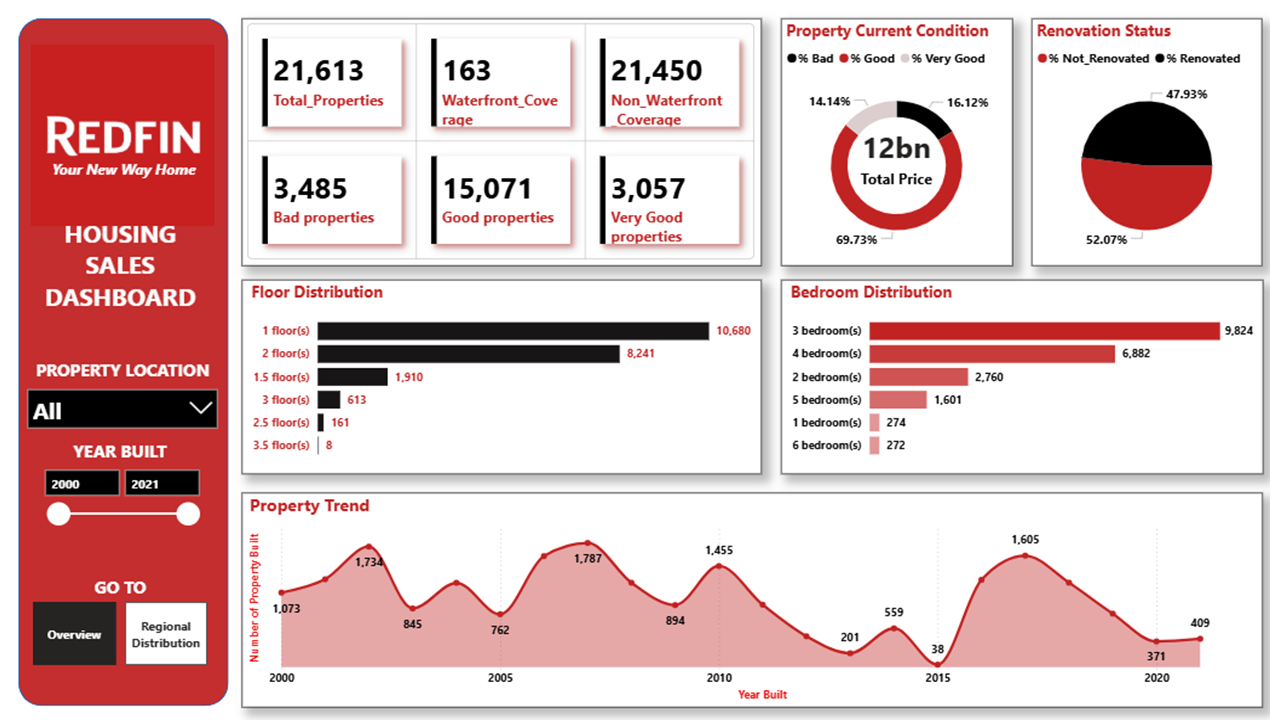
As part of my professional training at AVI, I analysed a modified dataset of over 21,000 residential properties across six U.S. states. Using Power BI, I performed advanced data cleaning, transformation, and visualisation to uncover trends related to property condition, renovation status, construction periods, and regional variations. I created an interactive dashboard designed to help investors, analysts, and real estate professionals explore data-driven insights that support informed decision-making in a dynamic housing market. Although this project was developed as part of my training, it showcases my ability to handle complex datasets and deliver clear, actionable visualisations that can create real business value.